TwistPlot · graphs and statistics
Drop in your table, pick a graph, and R runs the statistics. You leave with the whole figure, brackets included.
Version 8.50.1, released 9 November 2026. One account for the whole suite; during the beta, access is switched on by hand, usually within a day.
TwistPlot
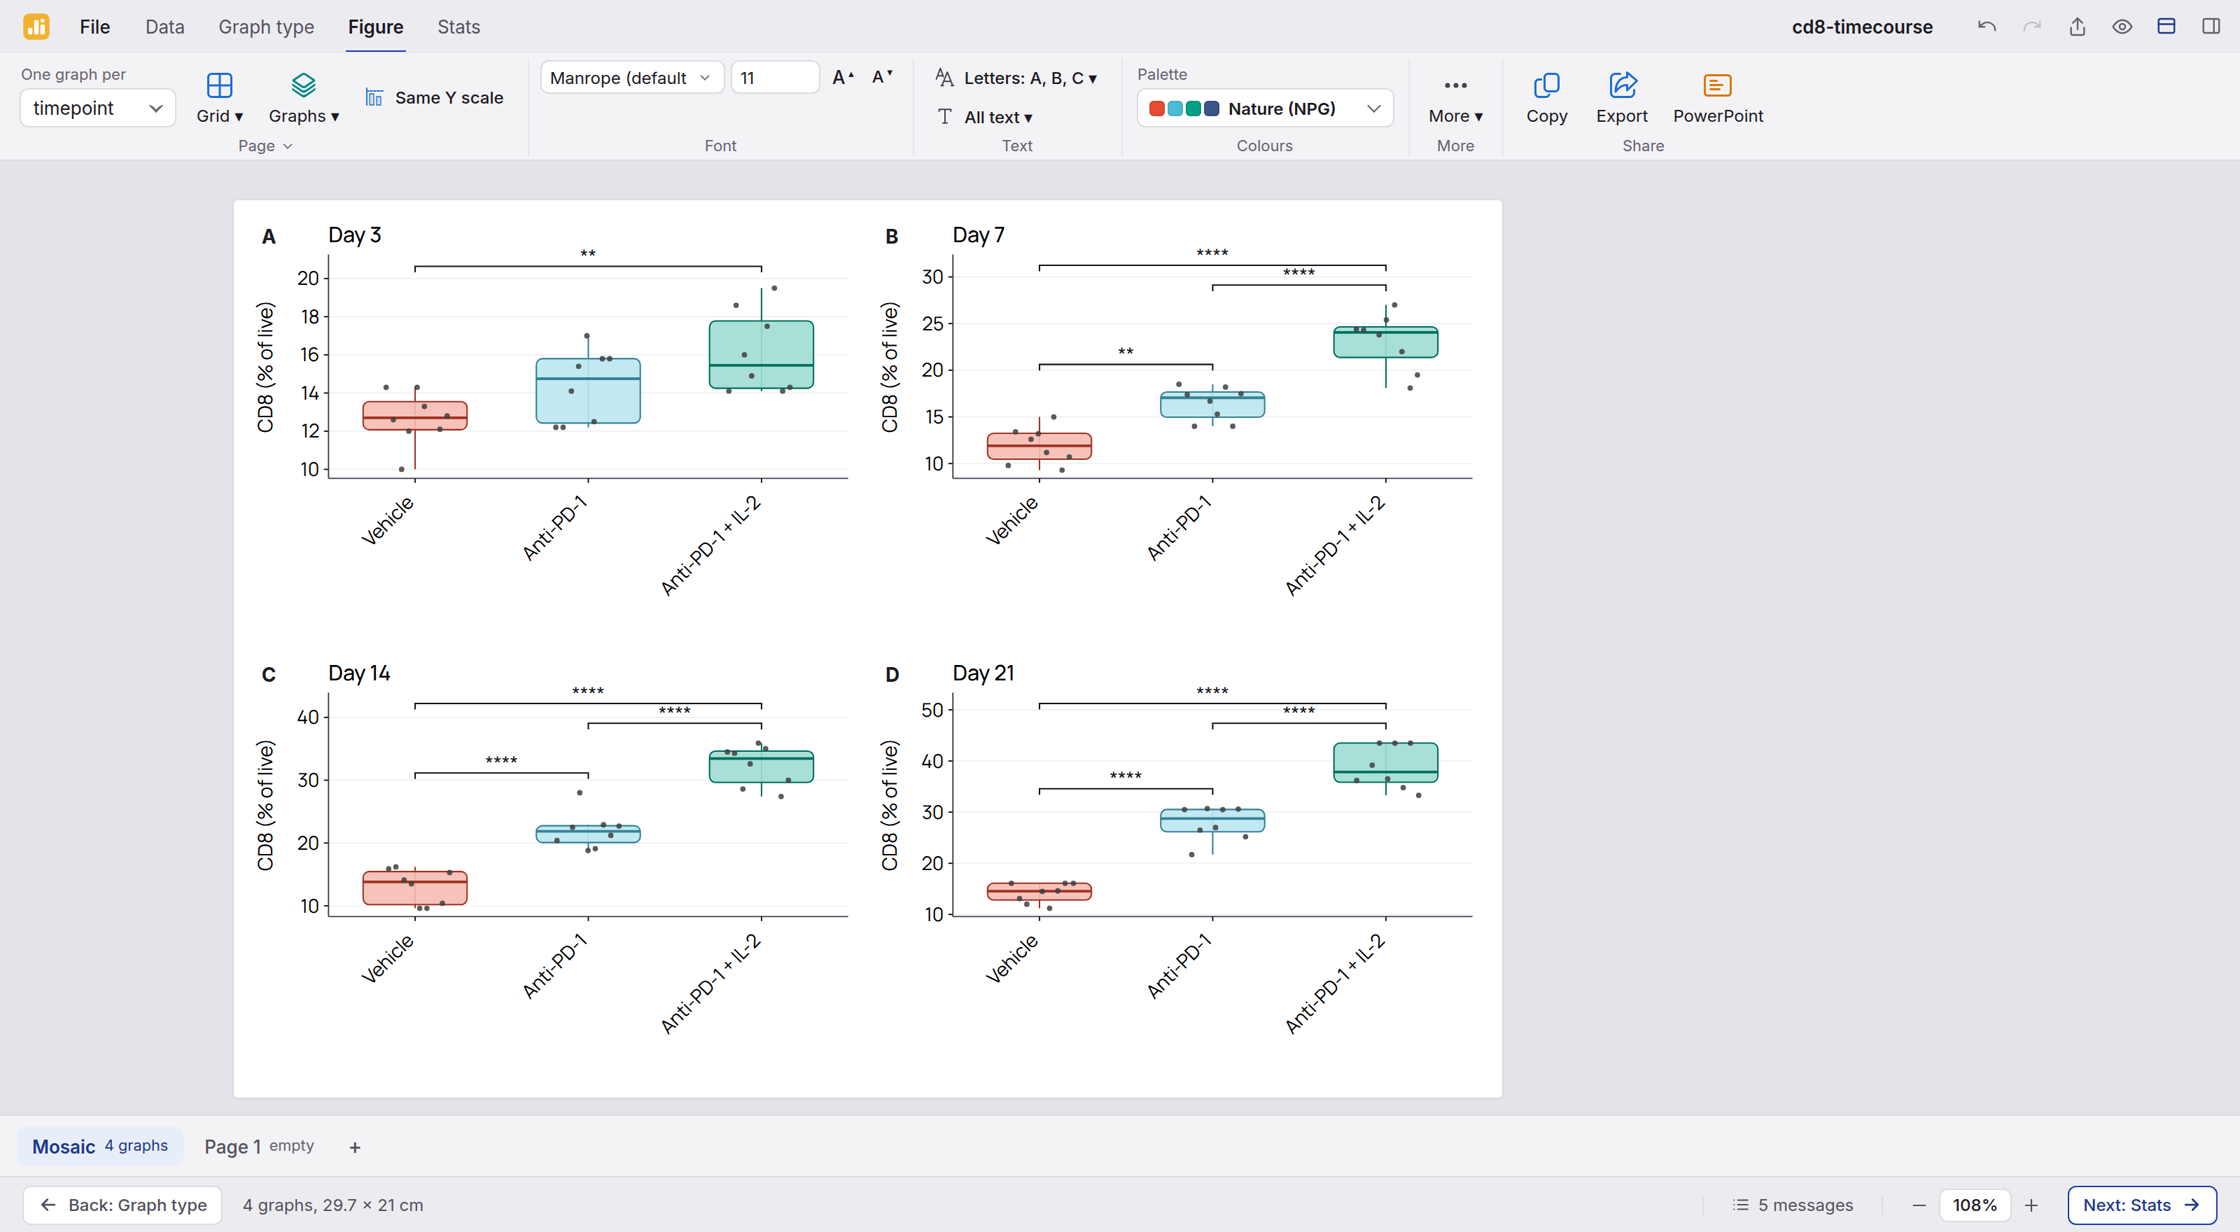
Built for bench biology: cohorts, cytometry exports, kinetics, survival. Three steps, in the order you work. Each step is a tab in the menu bar with its own ribbon, laid out like Word; Back and Next walk you through them. Every screen below is the app as it runs.
Graph type · the shapes your columns can feed
Pick a chart type and see it drawn on your data before you commit.
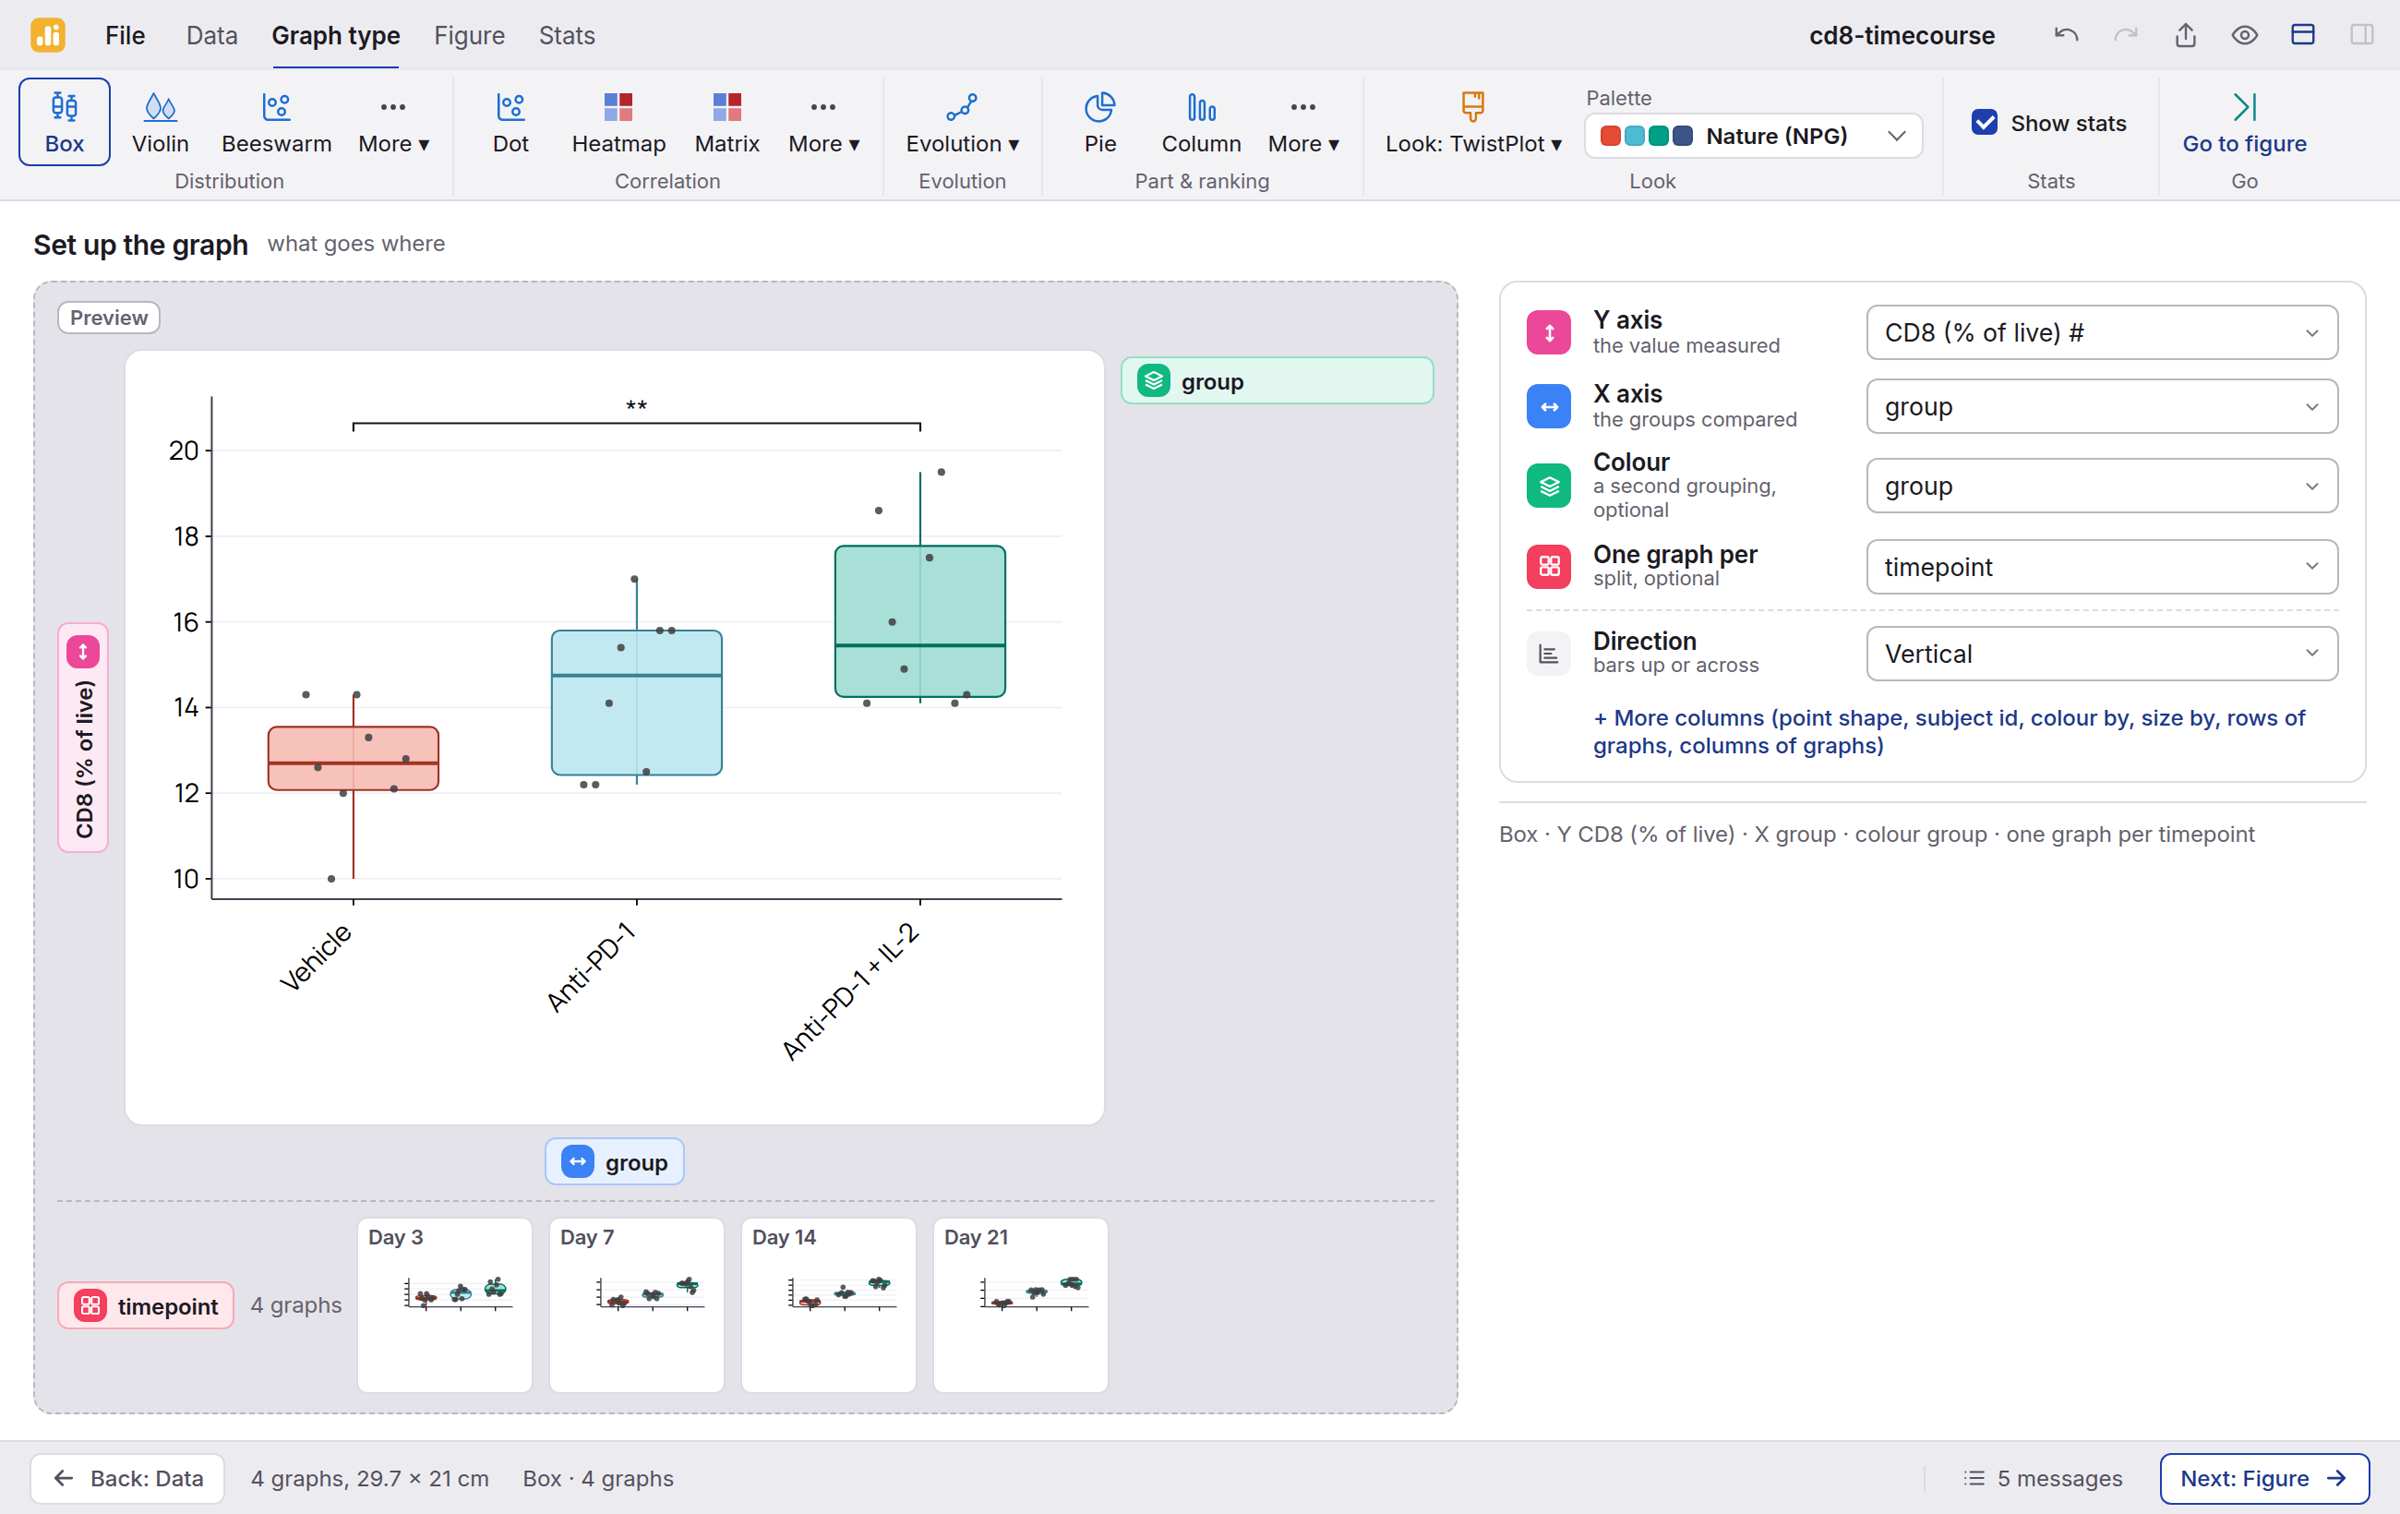
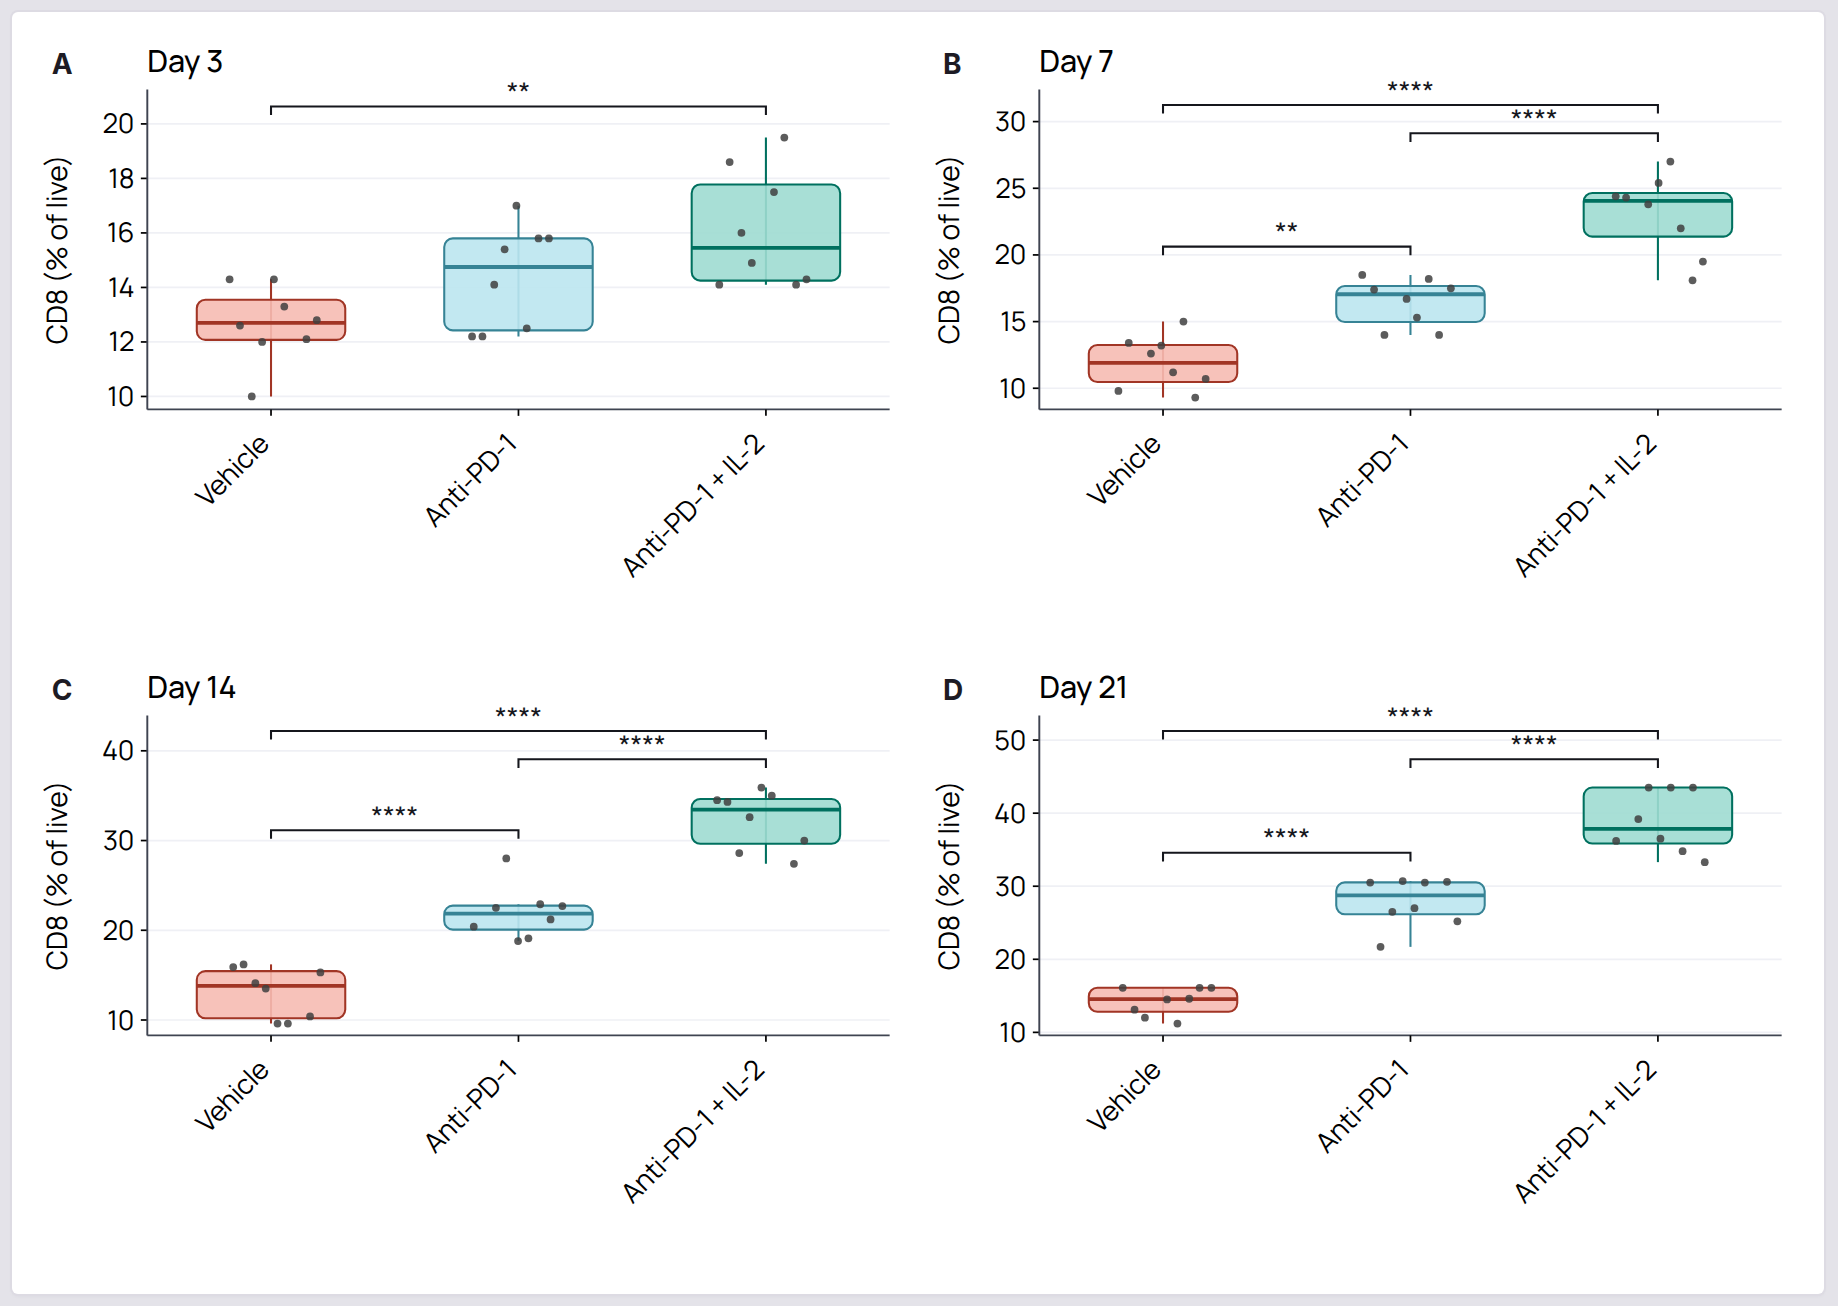
Figure · one page, four panels, one shared legend
Several panels on one page, with letters and one shared legend.
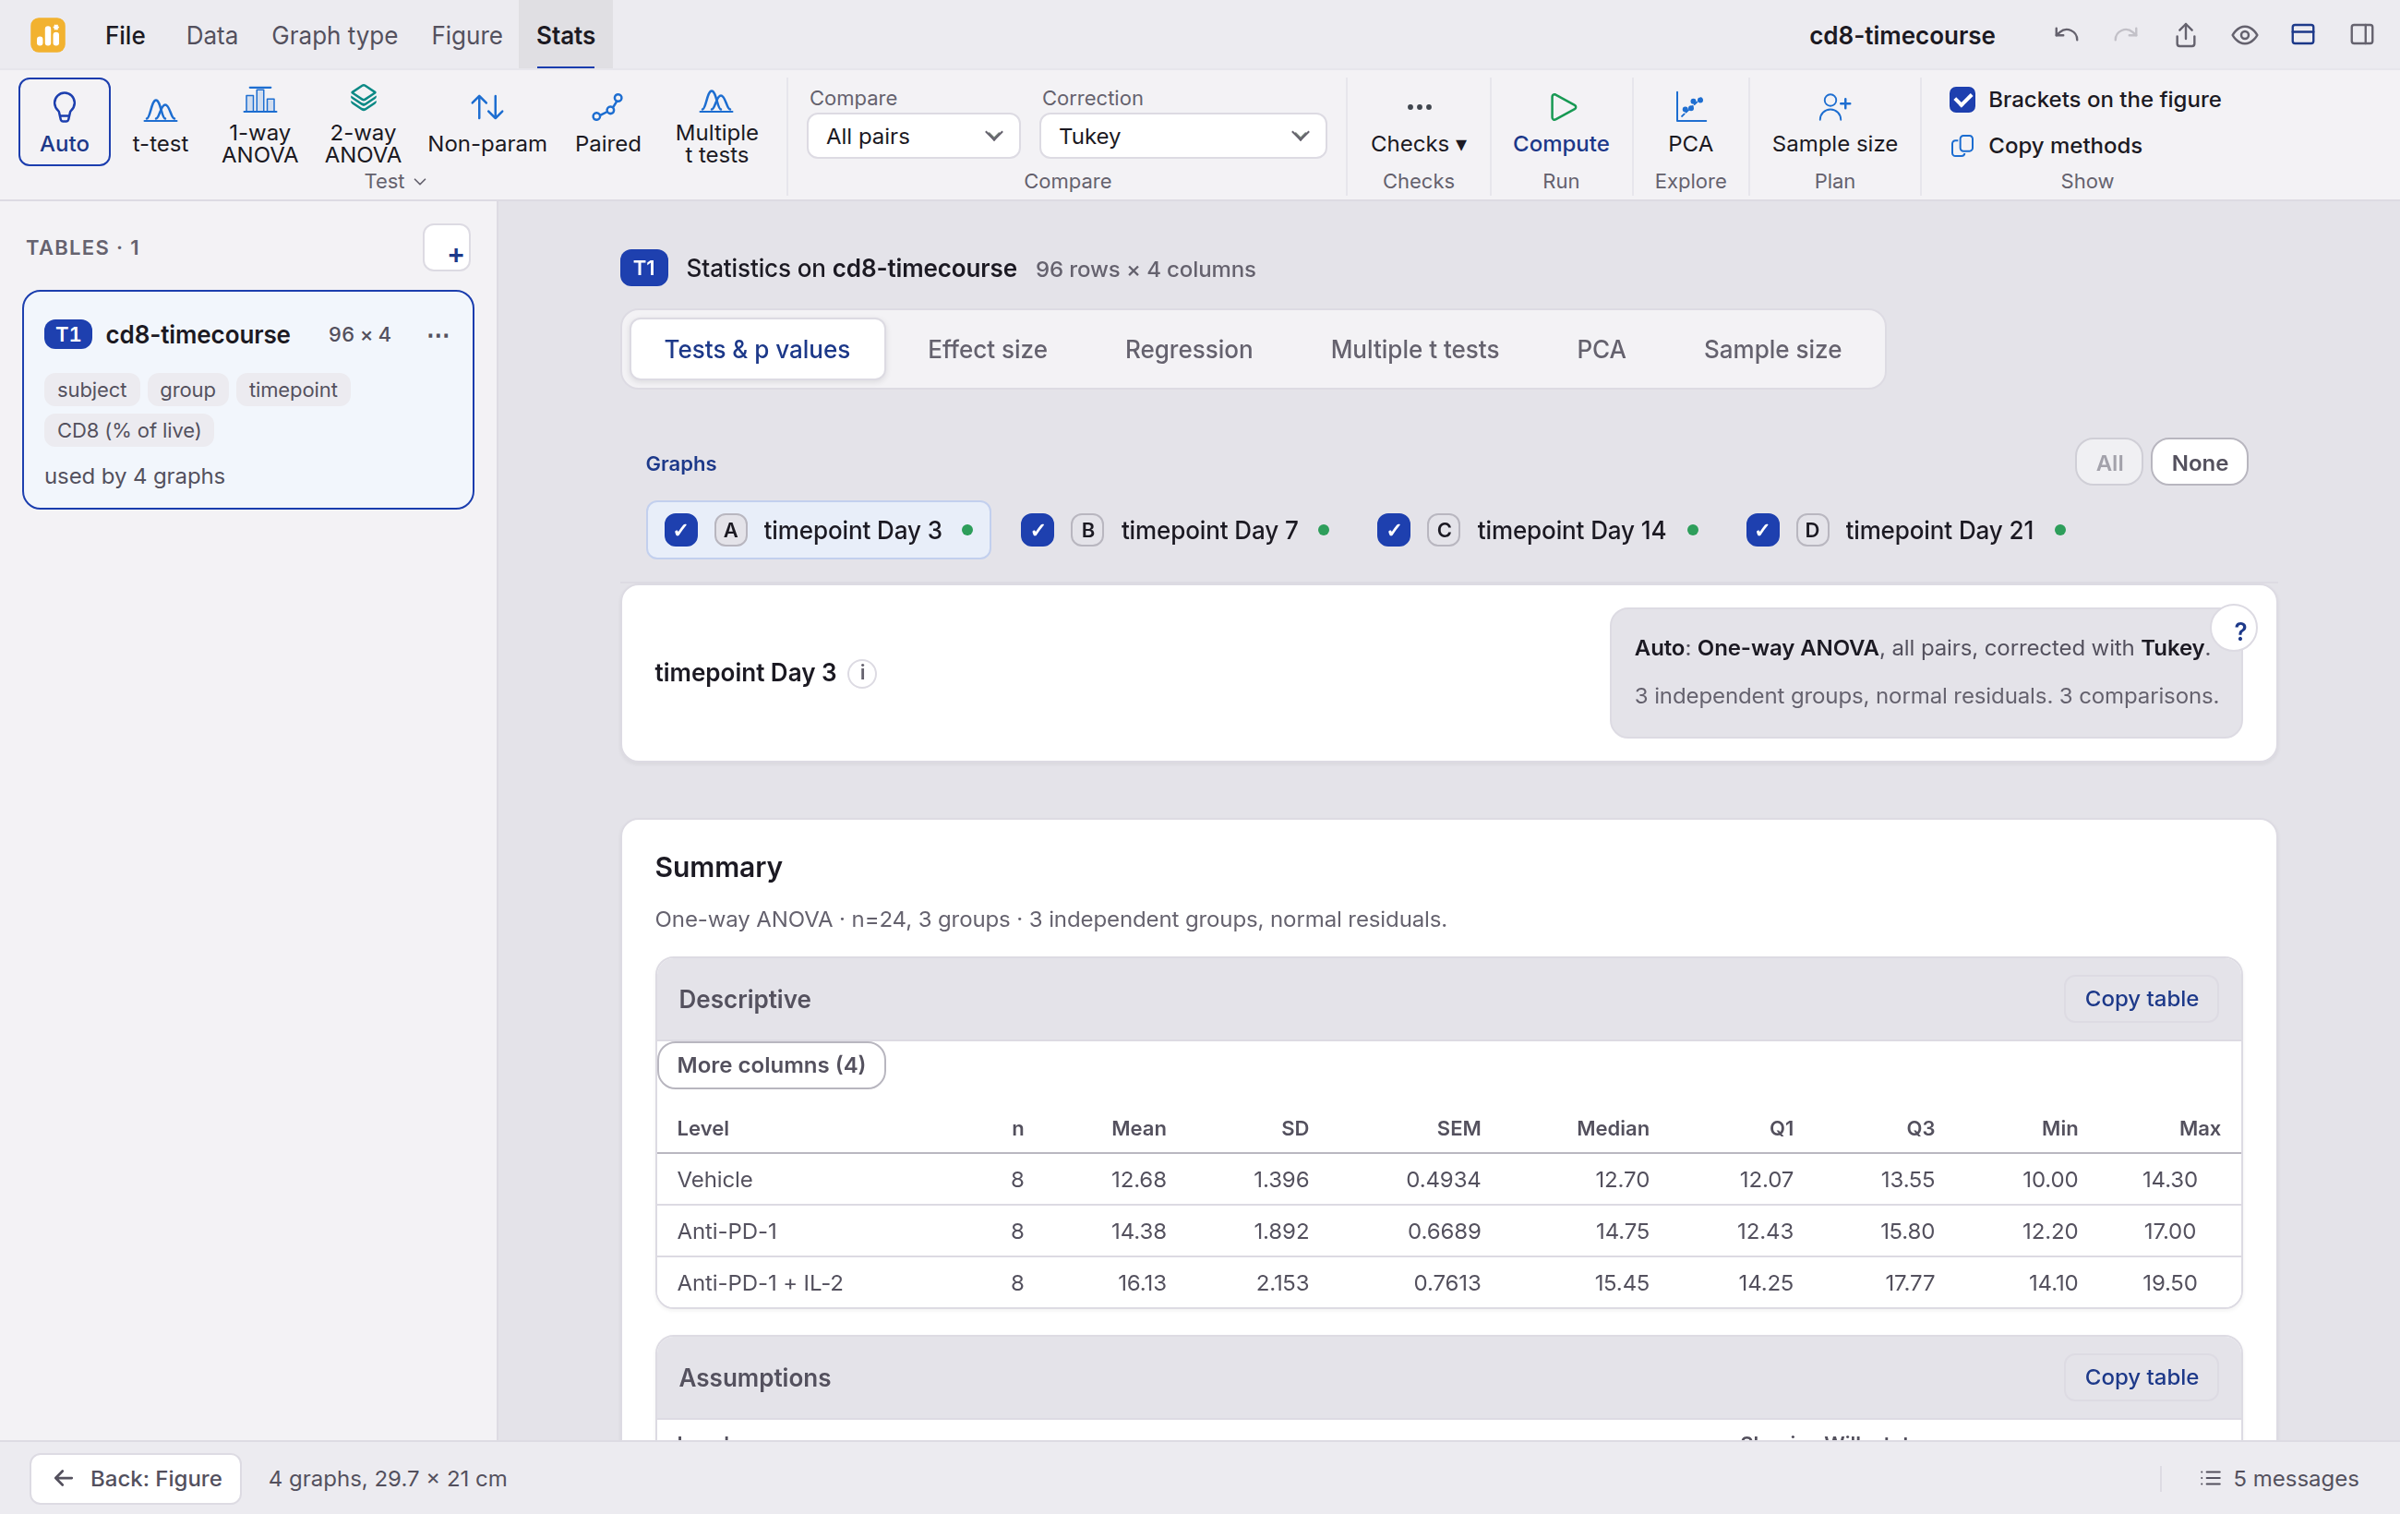
Stats · one-way ANOVA on three groups
The test chosen from your design, run in R, with its working shown.
Version 8.50.1
What TwistPlot reads, writes and computes, as of version 8.50.1.
What changed
TwistPlot, last 3 releases. The full list, by tool and by version, is on the release notes page of getatlascope.com.
Access
TwistPlot is one of the nine tools of Atlascope. One account opens all of them. During the beta, we switch new accounts on by hand, usually within a day.
If it plots, you will have a figure before your coffee goes cold. If it does not, tell us: the beta is shaped by what its testers hit.
One account for TwistPlot and the whole Atlascope suite. If you already have one, sign in. Forgot your password?
Signed in as
Atlascope
Same account, same way of working.
Swipe to look around, pinch to zoom.
 TwistPlot
 Sorbet
 CtExplorer
 CytoMix
 LavaSEQ
 FlowScope
 Plaquo
 Dizics
 Mirage